FEA Modeling Best-Practices when Expected Buckling Deformation is Not Initiated | Ansys Mechanical
In some symmetrical structures, the most likely shape for buckling may be ambiguous. In FEA models, some nonlinear large-displacement models may not buckle in an expected shape, because nothing initiates an expected buckling deformation. Success with such models can be aided if either a small load initiates the failed shape deformation, or if the “perfect” unloaded shape is slightly deformed in the pattern of a typical linear eigenvalue buckling shape.
Nonlinear Buckling Analysis | Ansys Workbench
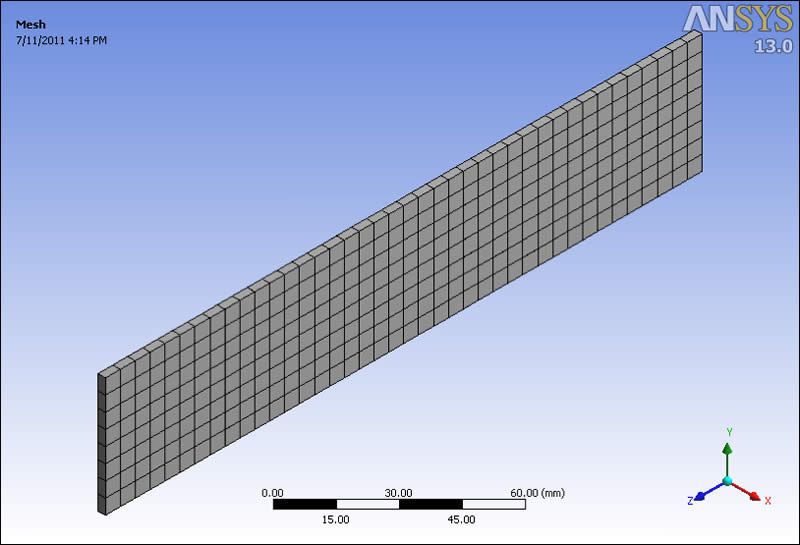
The following image shows a thin part subject to a pressure on the thin top face, and simply supported at the ends. The support is from Remote Displacement objects that prevent UX, UY, ROTY and ROTZ. The far end also prevents UZ. The part will bend like a simply supported beam. When sufficiently loaded, the part will buckle out of plane, in the UX direction.
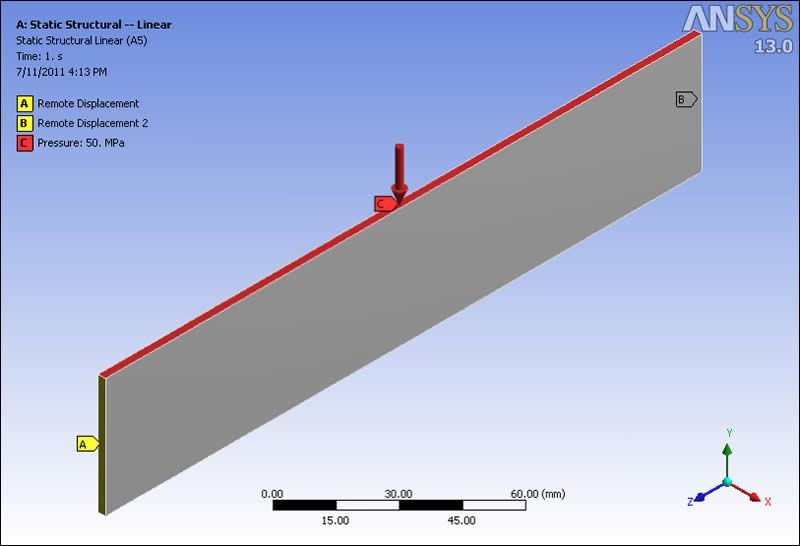
Note that the applied loading is a pressure on the thin upper face. In the large-displacement analysis, this pressure will act as a follower load, changing the direction in which it pushes as the face rotates. Users may prefer to apply a force to the face, so that the direction is not modified during large-displacement analysis.
Linear Eigenvalue Buckling Analysis based on the Applied Loads
The buckled shape can be seen further below. In a nonlinear large-displacement analysis, this example fails to buckle because of the perfect symmetry of the model and load. To trigger nonlinear buckling, some sort of UX offset loading or geometric imperfection needs to be applied. An often-preferred technique is to perform a linear eigenvalue buckling analysis based on the applied loads, and use a buckling mode deformation to apply a slight distortion to the unloaded mesh employed in the nonlinear large-displacement buckling analysis. This can be facilitated via the UPGEOM command of Ansys. In Workbench, the deformation can be applied by APDL Commands Objects.
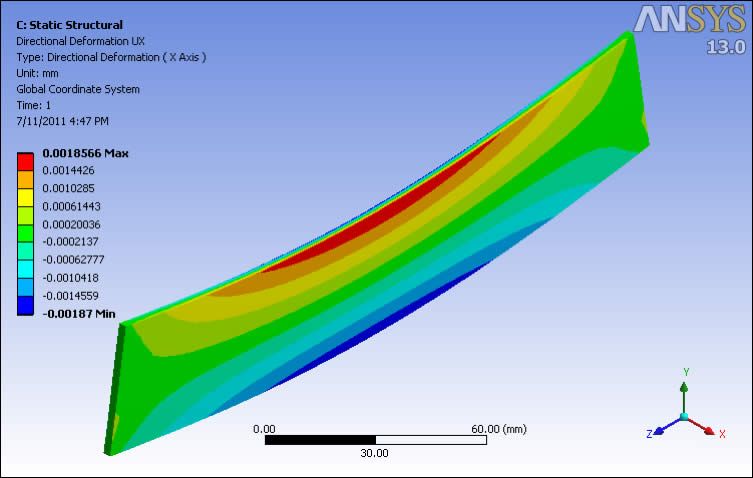
The following image shows a deformation plot for a large-displacement nonlinear analysis with the above loading. Deformation is in the YZ plane, without buckling in the UX direction. To trigger buckling in the UX direction, either a load in X is required, or a slight deformation of the unloaded mesh from a linear eigenvalue buckling analysis. (Note that the very slight UX movement is due to Poisson’s Ratio effects, but the significant movement is restricted to the YZ plane.)
Application of deformation of the unloaded mesh in a shape based on the result of a linear eigenvalue buckling analysis can be applied with UPGEOM, which adds displacements from a previous analysis (in this case a linear eigenvalue buckling analysis) and updates the geometry (node positions) of the finite element model mesh to the deformed configuration. The command includes selection of a load step/substep from a previous analysis, and a node displacement amplitude scaling factor. It is typical in pre-deformed nonlinear large displacement buckling analysis to apply a maximum displacement magnitude on the order of maximum manufacturing variation. The user must be aware of the units employed in solving to get the scaling factor to be appropriate.
This article illustrates nonlinear buckling with a pre-buckled linear buckling shape applied, using the Workbench Mechanical interface. Two small APDL Commands Object snippets are included in the model Outline that convey the result of a linear eigenvalue buckling analysis to the shape of the unloaded mesh in the nonlinear large-displacement buckling analysis.
Project Schematics for Models Undergoing Nonlinear Buckling Analysis
The following image shows a Project Schematic for a model that is to undergo nonlinear buckling analysis. The schematic starts with a Linear Static Structural Analysis for the chosen model. The full intended load can be applied, as long as it is suitable for providing pre-stress to a Linear Eigenvalue Buckling Analysis. The linear static analysis would use small displacement, linear material properties, and contact pairs that were all linear in their behavior—either bonded or no-separation.
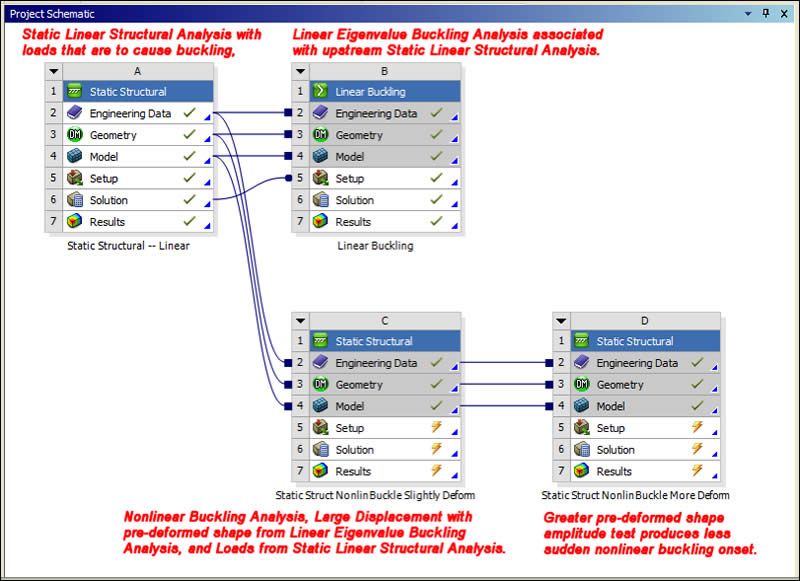
Below the Linear Eigenvalue Buckling Analysis, there is a schematic for a Nonlinear Buckling Analysis. Note that it shares “Model” taken from the Static Linear Structural Analysis. This means that all settings prior to the loading on the environment will be shared, and the analyses will be part of the same Outline in Workbench Mechanical.
There is a second Nonlinear Buckling Analysis schematic in the lower right corner of the Project Schematic image. This last analysis shares the same model. This final schematic was used to examine the result of applying a larger amplitude deformation by a linear eigenvalue buckling shape to the same model and loading.
The next image shows the Workbench Mechanical Outline resulting from the above Project Schematic. The static structural linear analysis environment automatically sends its loads into the linked linear buckling analysis environment. Below that are the two large-displacement nonlinear buckling analyses.
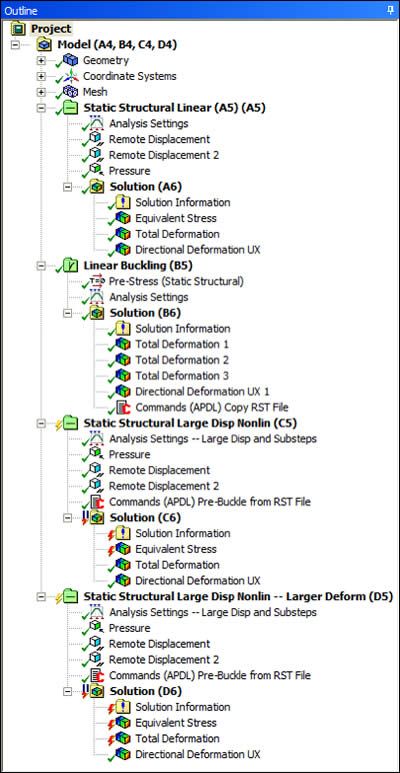
Note the presence of a Commands Object in the linear buckling postprocessing area. It makes a copy of the RST results file from the Linear Buckling analysis. There is another Commands Object in each nonlinear buckling environment, which applies a distortion taken from a chosen linear buckling mode shape in the RST file copy, using it to slightly distort the unloaded mesh in a nonlinear buckling run.
This model has been meshed with Solid Shell elements, requiring only one element through the thickness. Mapped meshing was employed.
The following image shows deformation for the first buckling mode as calculated in a Linear Eigenvalue Buckling model. Note that the “Time” is 0.89028 – this is the Load Factor, a factor indicating the fraction of the applied load that would cause buckling of the elastic structure. Note also that the largest displacement in this plot has been normalized to a value of 1.0.
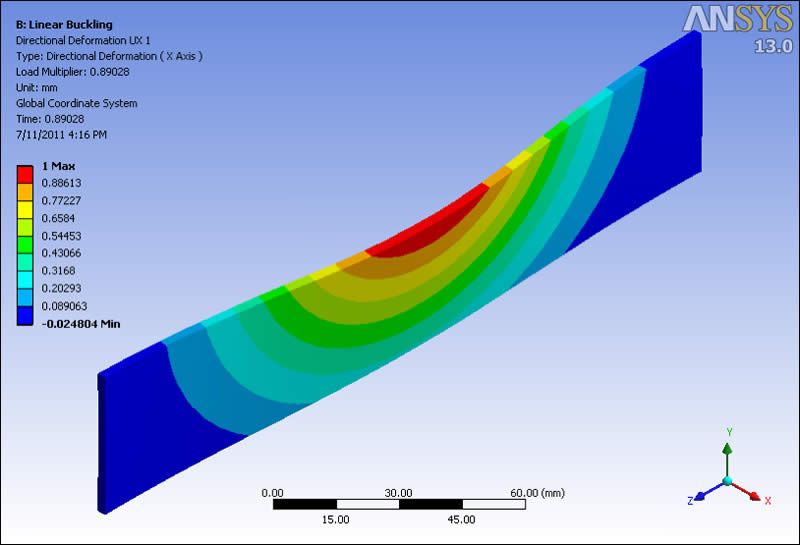
This shape can be chosen to drive a mesh deformation for the non-loaded mesh in the nonlinear buckling analysis that follows. The deformation is intended to help initiate this buckling shape in the nonlinear analysis.
In the postprocessing area of the Linear Eigenvalue Buckling analysis, an APDL Commands Object is inserted to write copy of RST file. It is placed two levels up in the file system subdirectories. This is at the same level as the Workbench project file, and should act as a “neutral” location. Users may prefer a location of their own choosing, but it should be able to be reached via relative directory references.
Here is the APDL Commands Object contents:
! Commands inserted into this file will be executed immediately after the Ansys /POST1 command.
! Active UNIT system in Workbench when this object was created: Metric (mm, t, N, s, mV, mA)
! Make a copy of the results file for the buckling analysis
!
/copy,file,rst,,..\..\buckling,rst ! Save RST file two levels up
!
! For information only:
set,first ! first buckling mode
*get,my_factor,ACTIVE,,SET,FREQ ! “FREQ” for buckling load factor
The following APDL Commands Object is inserted at the environment level of the nonlinear buckling analysis. It will use the deformed buckling shape calculated for a chosen buckling mode to distort the mesh prior to large-displacement nonlinear buckling analysis. The user should set the factor in the UPGEOM command, and choose the load step/substep for which the distorted shape should be read. In this example, Load Step is 1 (implying the loading and boundary conditions in the Linear Eigenvalue Buckling analysis), and the Substep is also 1, implying the first buckling mode shape.
The factor used in UPGEOM below is 0.50. Since the units in the analysis are set to millimeters, this factor multiplied by the highest deformation of 1.0 in the above buckling mode implies a maximum non-loaded mesh deformation from the original geometry of 0.50 mm.
! Commands inserted into this file will be executed just prior to the Ansys SOLVE command.
! These commands may supersede command settings set by Workbench.
! Active UNIT system in Workbench when this object was created: Metric (mm, t, N, s, mV, mA)
! Refer to RST file copied to a “neutral” location earlier
! Adjust UPGEOM command to use load factor, load step, substep
! UPGEOM, FACTOR, LSTEP, SBSTEP, Fname, Ext
! — Adds displacements from a previous analysis and updates the geometry
! of the finite element model to the deformed configuration.
!
! In this example, use factor of 0.05 and first buckling mode shape
! Max displacement UX first buckling mode shape was 1.0 mm, so factor of 0.050
! implies 0.050mm UX maximum distortion, which is 0.0197 inches, a small fraction
! of the wall thickness in this model.
!
fini
/prep7
upgeom,0.050,1,1,..\..\buckling,rst ! Multiplies “factor” by mode 1 displacement
fini
/solu
In the results, nonlinear buckling was found to occur as the load approached a factor of 0.89 of the full load.
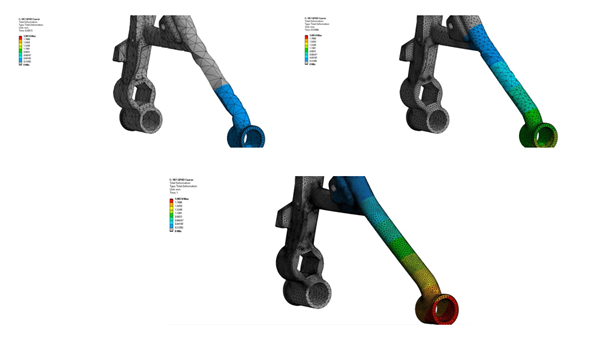
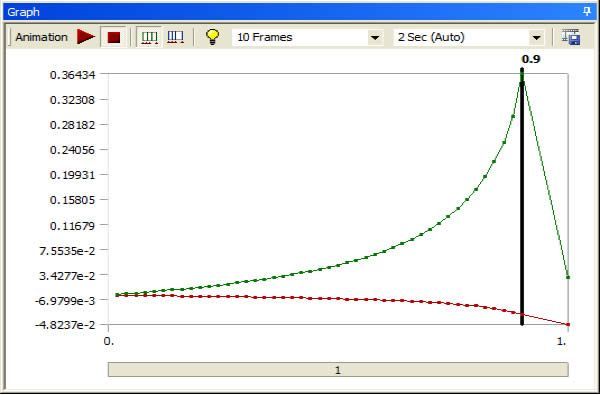
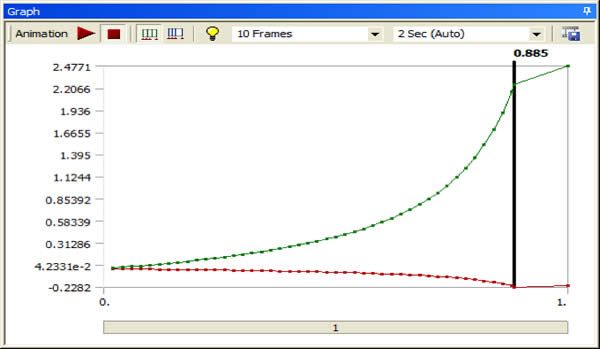
A second nonlinear buckling analysis was inserted into the Workbench Mechanical outline. It uses a larger factor on the UPGEOM command. This causes the buckling deformation to build up more gradually. With only very slight deformations of the original mesh, the onset of buckling is typically sudden, when the load gets close to the eigenvalue buckling load. This image shows the buildup of extreme deformations as the load is ramped up through substeps in a nonlinear buckling analysis with the mesh pre-deformed by the first linear eigenvalue buckling mode:
Pre-deformation Application given a Larger Amplitude
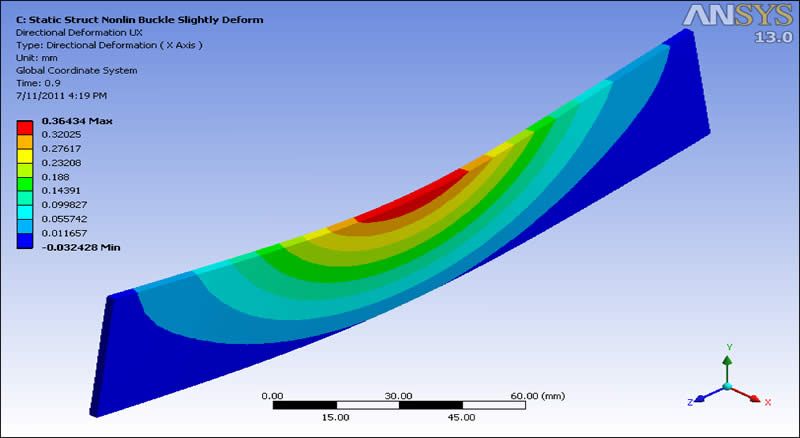
The following image shows what happens if a larger amplitude pre-deformation is applied… the nonlinear buckling event builds up less sharply, and in this example reaches a higher deformation before the analysis diverges.
At the end of the load ramp the last substep has diverged. The last converged substeps has been chosen for plotting. Note that the “Time” implies load factor, and that it is similar to the load factor discovered in the linear eigenvalue buckling analysis. With some geometries, the maximum converged load in a nonlinear eigenvalue analysis will be at a smaller fraction of the linear eigenvalue load factor. Note that the large displacement of a nonlinear buckling analysis should be illustrated as a confirmation that buckling has occurred, and the non-convergence is not a result of some other effect.
Contact for Additional Ansys Mechanical or Nonlinear Buckling Support
Finally, we hope that you can make productive use of our Nonlinear Buckling with Pre-Buckled Shape Distortion resource article for Ansys Mechanical Workbench. For more information, or to request engineering expertise for a particular use-case scenario surrounding nonlinear or ambiguous buckling, pre-buckled shape distortion or other related projects, please contact us here.
Additional Ansys Software Tips & Tricks Resources
- Analyzing normal and Tangential Elastic Foundations in Mechanical
- For support on Contained Fluid FEA Modeling with HSFLD242 Elements
- For Exporting a Deformed Geometry Shape Post-Analysis in Mechanical
- For guidance Multi-Step Analyses in Mechanical
- For Retrieving Beam Reaction Force in a Random Vibration Analysis
- Deploying Ansys Macro Programming vis *USE Command in Mechanical
- For replicating Fatigue Models from Start to Finish in Mechanical
- Setting up Acoustic Simulations of a Silencer
- For a step-by-step guide on 2D to 3D Submodeling in Mechanical
- For modeling Pipe16 Circumferential Stress in Mechanical
- For basic Ansys Software Installation and License Manager Updates