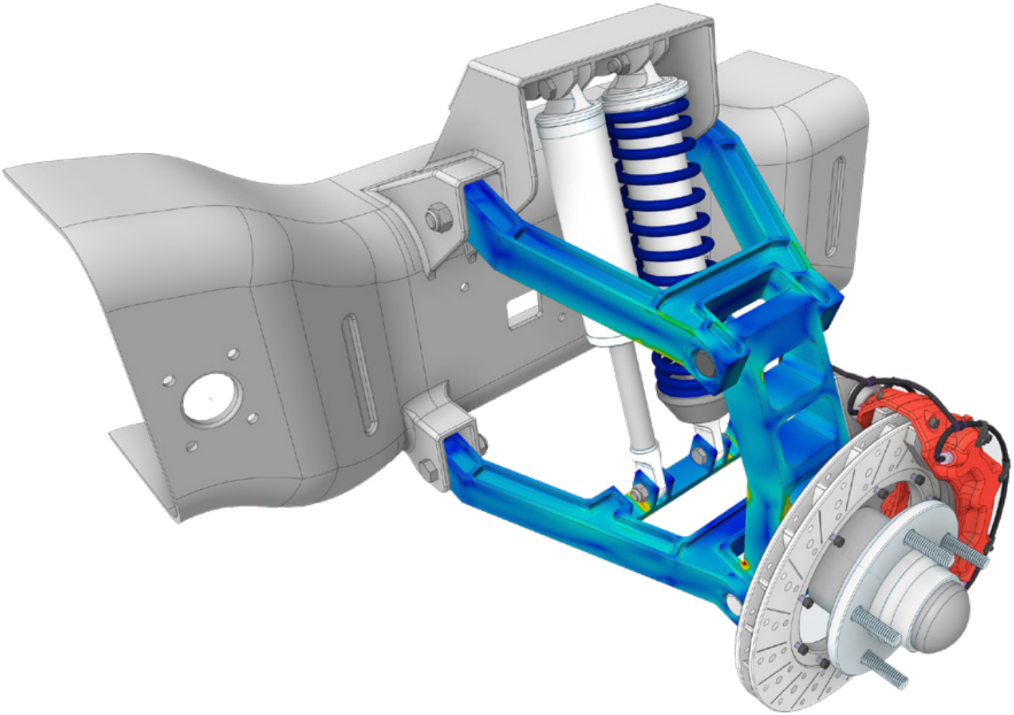
Have you wondered what other tools may be useful in determining the quality of your results? In addition to the convergence tools, you can also use Ansys’ contour results (contour plots) to help ensure quality results.
Normally, contour results in the Mechanical application are displayed as averaged results. Each element calculates a unique, elemental nodal stress which is typically different than the other elements connected to that node. Averaged contours will average elemental nodal results across element and geometric discontinuities but will never average results across bodies. Some results can also display as unaveraged contours.
How to Change the Averaging on Contour Results (by Settling the Display Option Field)
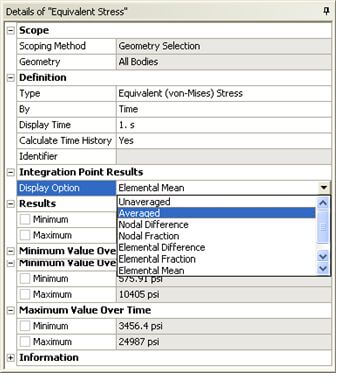
You can change the averaging on contour results by setting the Display Option field, shown in the figure below, to one of the following:
- Unaveraged: Displays unaveraged results.
- Averaged: Displays averaged results.
- Nodal Difference: Computes the maximum difference between the unaveraged computed result (for example, total heat flux, equivalent stress) for all elements that share a particular node.
- Nodal Fraction: Computes the ratio of the nodal difference and the nodal average.
- Difference (elemental): Computes the maximum difference between the unaveraged computed result (for example, total heat flux, equivalent stress) for all nodes in an element, including midside nodes.
- Fraction (elemental): Computes the ratio of the elemental difference and the elemental average.
- Mean (elemental): Computes the elemental average from the averaged component results.
Averaged Vs. Unaveraged Contour Results
The Nodal Difference, Nodal Fraction, Elemental Difference, and Elemental Fraction aid in determining mesh quality. If there are large differences in results calculated by elements attached to shared nodes, then a refined mesh in that region may be necessary.
The Elemental Mean will create a checkerboard of results where each element will have one value. The behavior is similar to the ETABLE feature within Ansys Mechanical APDL. Results can be exported to Microsoft Excel and subsequent calculations, such as summations, can be performed.
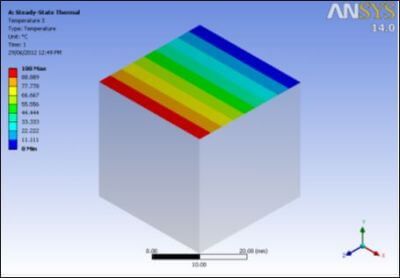
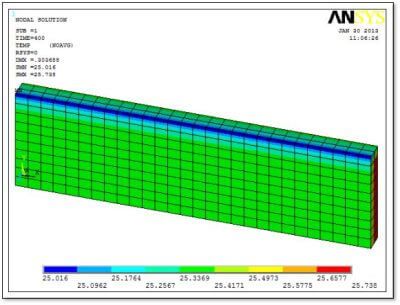
Contour plots display the results of a single data set (time step, load step, or sub step) over the base model geometry. The range of values in the results set is divided into several subranges (nine by default), and each subrange is assigned a color. The colors are then mapped over the geometry to indicate the result values at each location in the model. Most results for continuum (e.g., PLANE and SOLID) elements can be displayed as contour plots. For beam and shell elements, it may be required to issue the /ESHAPE command before creating a contour plot or to plot the outcomes using element tables instead.
Plots of the nodal solution can be created using the GUI path:
- Main Menu>General Postproc>Plot Results>Contour Plot>Nodal Solu
or
- Using the PLNSOL
Contour plots of the element solution can be created using the GUI path:
- Main Menu>General Postproc>Plot Results>Contour Plot>Element Solu
or
- Using the PLESOL
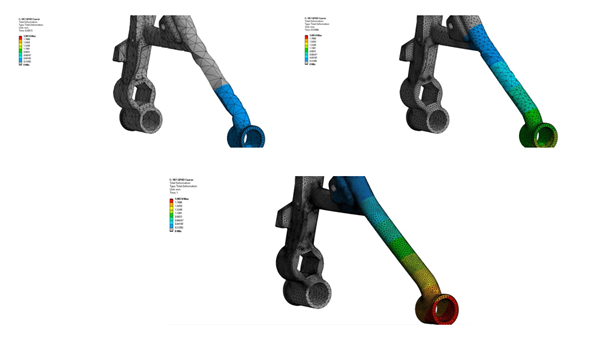
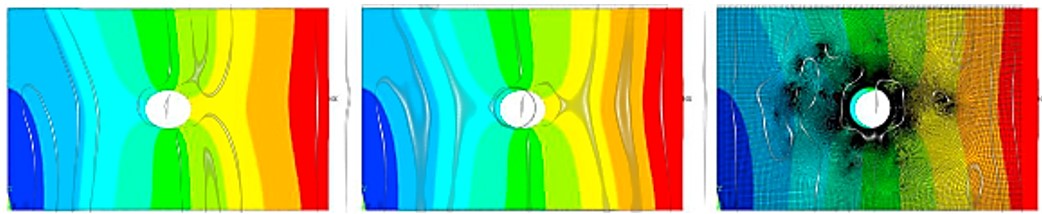
There are three important display options for contour plots: the non-displaced shape key, the scale factor, and the contour scale. The displaced shape option controls if and how the deformed model is shown in comparison to the undeformed (original) geometry. The “Deformed shape only” is the default and provides no basis for comparison (Figure 1, left). The “Deformed shape with undeformed edge” option overlays the contour plot on an outline of the original model (Figure 1, center). The “Deformed shape with undeformed model” option overlays the contour plot on the original finite element model (Figure 1, right).
Displacement Vector Sum from Ansys Contour
The scale factor determines if and how the deformed model is displayed in comparison to its as-calculated state. The deformations in most finite element models are relatively small and would be difficult or impossible to view if they were plotted as calculated (at their true scale). Therefore, ANSYS automatically scales the maximum displacement to 5% of the model dimension. The resulting scale factor is shown in grey to the right of the Scale Factor drop down menu in the Contour Solution Data dialog boxes.
Ansys Contour Plot Controls Showing the Auto Calculated Scale Factor
Finally, you can control the color contour display using the menus accessible via the GUI path:
- Utility Menu>PlotCtrls>Style>Contours.
Here, it is possible to specify the number of contour intervals to use and to set the minimum and maximum contour values. Using the same number of contour intervals and the same minimum and maximum values on multiple plots allows meaningful side-by-side comparison of results from the same or similar models. This is a very powerful technique that will help ensure integrity and accuracy.
Contact for Additional Ansys Mechanical Contour Support
Finally, we hope that you are able make productive use of our Ansys contour plots and configuration support article. For more information, or to request engineering expertise for a particular use-case scenario surrounding Ansys contouring, please contact us here.
Additional Ansys Software Tips & Tricks Resources
-
- Analyzing normal and Tangential Elastic Foundations in Mechanical
- Why Meshing is Crucial for FEA Fluid Simulations Prior to Prototyping
- For support on Contained Fluid FEA Modeling with HSFLD242 Elements
- For Exporting a Deformed Geometry Shape Post-Analysis in Mechanical
- Moreover, for guidance Multi-Step Analyses in Mechanical
- For Retrieving Beam Reaction Force in a Random Vibration Analysis
- Deploying Ansys Macro Programming vis *USE Command in Mechanical
- For replicating Fatigue Models from Start to Finish in Mechanical
- In addition, setting up Acoustic Simulations of a Silencer
- For a step-by-step guide on 2D to 3D Submodeling in Mechanical
- For modeling Pipe16 Circumferential Stress in Mechanical
- For Support on performing ‘EKILL‘ in Workbench
- APDL Command Objects post-Spectral Analysis
- For Separating DB Database Files from RST Files
- Measuring Geometric Rotation in Mechanical WB
- Explicitly, CAD Geometry Deformation Plasticity
- Offsetting a Temperature Result to Degrees Absolute
- For general guidance on Ansys Post-Processing
- Finally, for basic Ansys Software Installation and License Manager Updates